| Total Cases/Population |
Weekly New Cases/Population |
|---|---|
| Total Fatalities/Population |
Weekly Fatalities/Population |
| Total Case Fatality Rate |
Total Cases/Population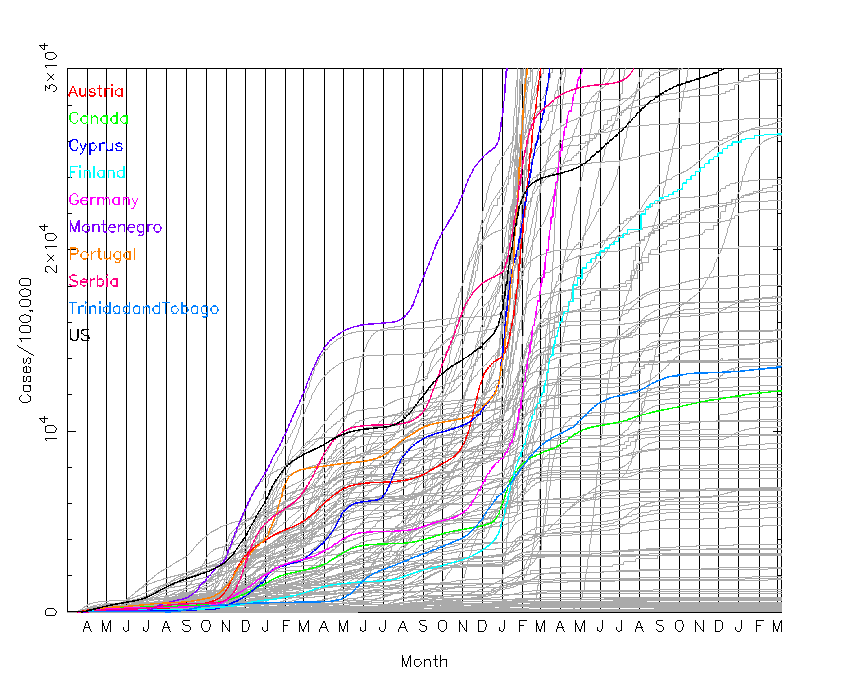 |
Weekly New Cases/Population |
|---|---|
| Total Fatalities/Population |
Weekly Fatalities/Population |
| Total Case Fatality Rate |
There is no guarantee of the accuracy of the data provided here. While many metrics are similar to what states are using for re-opening guidance, there can be differences in the details of the calculations or the dates in which the metrics are calculated. Please refer to your state's health department data for specific guidance. For example, general COVID-19 data from the Arizona Department of Health Services can be found here, while school opening specific data can be found here.
Data tables provide totals, total over past week, and average of last two weeks. Statistics include cases, fatalities, and fatality rate and can be viewed as raw values or per 100,000 population. For US states, statistics also include tests and positivity rate. All tables can be re-sorted by clicking on the column header.
Plots provide cumulative and previous-week totals. Worldwide plots show all countries with at least 1000 fatalities reported. Highlighted in color for the worldwide plots are the nine countries with highest previous-week death rates, as well as the USA. State-by-state plots show all 50 states plus the District of Columbia. Highlighted in color for the state-by-state plots are the nine states with highest previous-week positivity rate, as well as Arizona. Full-size plots can be viewed by clicking on the thumbnails. Vertical lines represent the first of each month.
Note that the statistics, especially weekly totals and two-week averages, can be artificially high or low based on adjustments in reporting standards, which can result in significant increases or decreases in statistics from one day to the next. The accuracy of the data is limited by the timeliness, accuracy, and consistency of the input data sources, which varies state to state and country to country.
To attempt to model weekly fatality rates, I have developed a simple model to insert a delay function (a log-normal distribution where both median and standard deviation are solved using maximum likelihood) onto the US positive cases data, and then estimate what fraction of those positive cases ultimately died. The quality of the fit can be assessed by comparing the two lines below in the left plot. Caveat: unlike the above plots, the plots below involve modeling. The modeling approach and results are for this website's author's interest only, and are not peer reviewed or otherwise independently verified. Additionally, confidence intervals around the model parameters are not calculated or plotted.
Note that the plot of fatality rate superficially appears to indicate the likelihood of someone who is ill with COVID-19 perishing, but it should be emphasized it is the likelihood of a positive case resulting in a fatality. However, other factors related to the accuracy and completeness of the data are likely in play as well. Examples include:
US Weekly COVID-19 Fatalities (Model vs. Reported)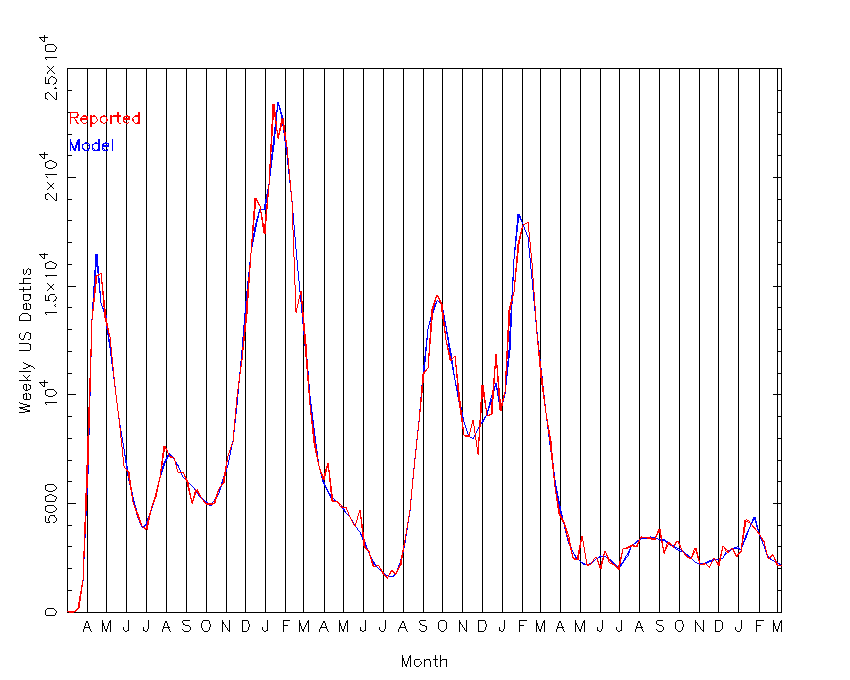 |
Estimated US Fatality Rate |
|---|
The CDC maintains a database of voluntarily-reported adverse reactions to vaccines, the VAERS database. A caveat for use of these data is that events are reported by patients so reporting could be potentially incomplete (event not reported) overreported (event was medically unrelated to the vaccine), or inaccurate (data was reported incorrectly). That said, concerns over vaccine safety suggest that it would be worthwhile to crunch those numbers into simple-to-read tables.
For transparency, data were obtained using this web search for deaths, this search for all reported adverse events, and this search for reported myocarditis cases. Since the site is updated daily but my scripts do not facilitate daily data pulls the way the rest of this page does, I am also including the most most recent death, all event, and myocarditis data I have retrieved. The latter links also include the CDC's caveats regarding use of the data. Data were last retrieved on Mar 27, 2022 12:41:05 PM for fatalities, Mar 27, 2022 12:41:36 PM for all adverse reactions, Mar 27, 2022 12:42:04 PM and for myocarditis cases (all Eastern time).
VAERS data includes breakdown of vaccine manufacturer, gender, age, and days since the vaccine was given. Below links show total reported US deaths for all combinations of those four variables. Note these are raw totals; without data on number of vaccines given by manufacturer, gender, and age, or estimated reporting rates of events, it is impossible to draw conclusions from the VAERS data alone.
Also, not that the age and days since shot data are provided by variable width bins (e.g., 0 days since vaccine includes only one day, while 15-30 days included 16 days), pages showing those data (per year of age and/or per day since vaccinated) in addition to the raw count totals.
| VAERS Reported Deaths | All VAERS Reported Events | VAERS Reported Myocarditis Cases |
|---|---|---|